Tankers: US Crude Oil Exports Further Down in 2025

US crude oil exports have been impacted by the tariff wars, as volumes retreated during the first four months of 2025. In its latest weekly report, shipbroker Banchero Costa said that “after a positive 2023, when global crude oil loadings increased by +5% y-o-y, things got quieter in 2024. In Jan-Dec 2024, global crude oil loadings were unchanged, beying up by +0.2% y-o-y, excluding all cabotage trade, according to vesselstracking data from Refinitiv. Exports from the Middle East Gulf were unchanged +0.1% y-o-y to 17.5 mln bpd. In Jan-Dec 2024, MEG accounted for 40% of global seaborne crude trade. Exports from Russian ports (including oil of Kazakh origin) declined by -0.8% y-o-y to 4.6 mln bpd, or 10.4% of global trade. From the USA, exports ended up flat +0.0% y-o-y at 4.1 mln bpd in Jan-Dec 2024, or 9.3% of global trade. From South America, exports surged by +10.9% y-o-y to 3.8 mln bpd, 8.8% of global trade. From West Africa, exports declined by -1.9% y-o-y to 3.4 mln bpd, 7.7% of global trade. From ASEAN exports increased by +4.8% y-o-y to 2.5 mln bpd in JanDec 2024 (this inevitably includes re-export of Russian origin volumes)”.
Source: Banchero Costa
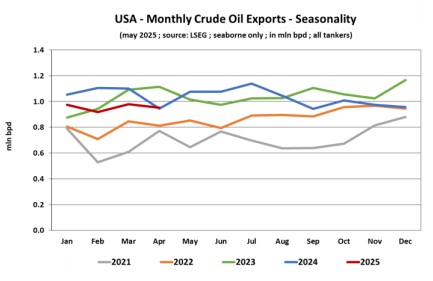
According to Banchero Costa, “while waiting to see the effects on trade of OPEC+ decision to unwind production cuts starting in May, during the first 4 months of 2025, global exports were down -2% compared to the same period (January-April) of 2024, almost 1 mln bpd less. Exports from MEG were down – 1.4% to 17.6 mln bpd. Exports from Russia were down -5.8%. During the first 4 months of 2025 South America exported more crude than USA with exports growing +5.2% while exports from USA dropped -9.1%. Exports from West Africa were unchanged, while North African exports overtook ASEAN exports thanks to a +3.3% increase while ASEAN dropped -20.4% (once again remind you of the re-export play of Russian origin volumes)”.

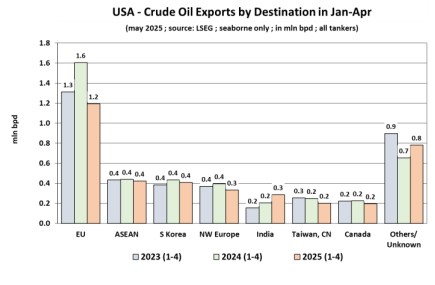
“As said, during the first 4 months of the year, USA crude oil exports were down -9.1%. Exports were heavily down to EU, -25.6% to 1.2 mln bpd. EU remains in any case, by far, the largest importer of USA crude with a share of 31.2%. EU seaborne crude oil imports were down -8.1% overall during the first 4 months of the year to 9.1 mln bpd, a net loss of 800,000 bpd compared to the same period in 2024. EU recorded lower volumes from all its major exporters, except South America that now source around 10% of EU imports.
Source: Banchero Costa
The second largest importer of USA crude were ASEAN countries with volumes down to 420,000 bpd, – 3.8% y-o-y. The third largest importer of USA crude exports, with a share of 10.7%, was South Korea. Exports to the country were down -5.8%. The fourth largest importer of USA crude exports, with a share of 8.7%, was Northwest Europe that recorded -16.0%. Fifth was India with a share of 7.5%. To India, USA crude exports increased by 40.0% to 290,000 bpd. Corpus Christi accounts for 63% of total exports, followed by Huston 13% and Galveston 7%. LOOP, the other major VLCC loading port accounts for only 3% of total USA crude exports. VLCCs that accounted for 51% of total exports, followed by Suezmax 24% and Aframax 22%”, the shipbroker concluded.
Nikos Roussanoglou, Hellenic Shipping News Worldwide