Tankers: China’s Crude Oil Imports Retreating

China’s crude oil imports have been declining since the start of 2025. In its latest weekly report, shipbroker Banchero Costa said that “in Jan-Dec 2024, global crude oil loadings went up by a modest +0.4% y-o-y to 2194.6 mln tonnes, excluding all cabotage trade, according to vessels tracking data from LSEG. This year started even worse, with global loadings in Jan-Jul 2025 down by -0.8% y-o-y to just 1276.3 mln tonnes. Exports from the Arabian Gulf were up by +0.1% y-o-y to 510.0 mln t in Jan-Jul 2025, accounting for 40.0% of seaborne crude trade. Exports from Russian ports (including oil of Kazakh origin) declined by -3.7% y-o-y in Jan-Jul 2025 to 132.1 mln tonnes, or 10.4% of global trade. From South America, exports increased by +7.2% y-o-y to 122.8 mln t, with a share of 9.6%. From the USA, exports declined by -13.6% y-o-y at 103.1 mln tonnes in Jan-Jul 2025, an 8.1% share. From South East Asia exports declined by -12.6% y-o-y to 64.7 mln t in Jan-Jul 2025 (but this inevitably reflects changes in the re-export of Russian origin volumes).
Source: Banchero Costa Shipbrokers
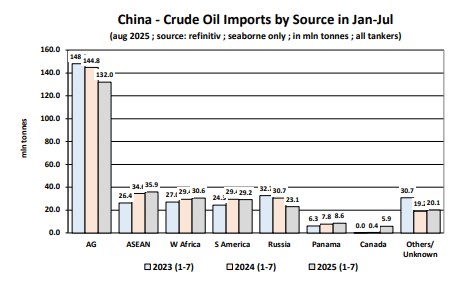
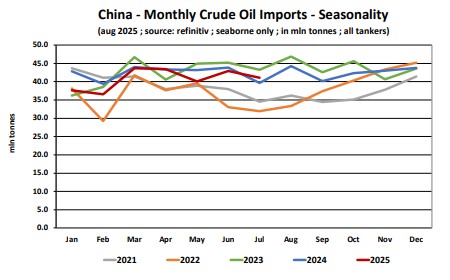
According to Banchero Costa, “in terms of demand, the top seaborne importer of crude oil in Jan-Jul 2025 was Mainland China, accounting for 22.5% of global trade. Volumes into China declined -3.7% yo-y to 285.4 mln t in Jan-Jul 2025. Imports to the EU27 declined by -5.4% y-o-y to 264.2 mln t. To ASEAN, imports increased by +3.7% y-o-y to 162.7 mln t (again this includes Russian volumes later re-exported elsewhere in Asia). To India, volumes increased +1.2% yo-y to 139.9 mln t in Jan-Jul 2025. Mainland China is right now the largest importer of crude oil in the world, with a 22.5% share, once again marginally ahead of the European Union’s 20.9% share. In Jan-Dec 2023, China imported 514.9 mln tonnes of crude oil by sea, excluding cabotage, a jump of +14.2% y-o-y compared to the 450.9 mln tonnes imported in 2022. In Jan-Dec 2024, imports into China corrected slightly by -0.6% y-o-y to 511.8 mln tonnes. In Jan-Jul 2025, crude imports volumes into China corrected downwards by -3.7% y-o-y to 285.4 mln t, from 296.3 mln t in the first 7 months of 2024, but still above the 251.3 mln t in Jan-Jul 2022”.

The shipbroker added that “about 84.8 percent of volumes discharged in China in Jan-Jul 2025 were carried in VLCCs, about 3.0 percent were carried in Suezmaxes, and 11.6 percent in Aframaxes. Main crude oil import terminals in China are: Ningbo/Zhoushan (44.2 mln tonnes in Jan-Jul 2025), Lanshan (31.3 mln t), Dongjiakou (22.4), Dalian (19.9), Qingdao (19.7), Quanzhou (14.1), Beilun (13.5), Zhanjiang (12.8), Huizhou (12.0), Yantai (11.5), Tianjin (10.9), Shuidong (10.5), Jieyang (9.2), Cezi (7.7), Caofeidian (6.7). In terms of sources of the shipments, the majority of China’s oil imports arrives from the Middle East. Saudi Arabia is the single largest exporter to China, accounting for 15.5% of volumes in Jan-Jul 2025. In Jan-Jul 2025, China imported 44.3 mln tonnes of crude oil from Saudi Arabia, down -4.1% y-o-y on the same period of last year. In the same period, imports from Iraq to China increased by +0.6% y-oy to 35.5 mln t, and from Kuwait by +13.7% y-o-y to 8.5 mln t.
Source: Banchero Costa Shipbrokers
Volumes from the UAE to China declined by -12.0% y-o-y to 16.5 mln t, and from Oman by -15.7% y-o-y to 20.5 mln t. Direct shipments from Russia declined by -24.9% y-o-y in Jan-Jul 2025 to 23.1 mln t. Russia now accounts for just 8.1% of China’s overall seaborne crude oil imports. Imports from ASEAN (which includes some trans-shipment of Iranian and Russian oil) increased by +4.0% y-o-y to 35.9 mln t in Jan-Jul 2025, and from West Africa by +3.9% y-o-y to 30.6 mln t. Volumes from Canada surged to 5.9 mln t in Jan-Jul 2025 from just 0.4 mln t in the same period last year”, Banchero Costa concluded.
Nikos Roussanoglou, Hellenic Shipping News Worldwide