Lower Charter Rates Hit Dorian LPG’s Results

Dorian LPG Ltd., a leading owner and operator of modern very large gas carriers (“VLGCs”), today reported its financial results for the three months and fiscal year ended March 31, 2025.
Key Recent Developments
- Declared an irregular cash dividend of $0.50 per share of the Company’s common stock totaling $21.3 million to be paid on or about May 30, 2025 to all shareholders of record as of the close of business on May 16, 2025.
Highlights for the Fourth Quarter Ended March 31, 2025
- Revenues of $75.9 million.
- Time charter equivalent (“TCE”)(1) per available day rate for our fleet of $35,324.
- Net income of $8.1 million, or $0.19 earnings per diluted share (“EPS”), and adjusted net income(1) of $10.7 million, or $0.25 adjusted diluted earnings per share (“adjusted EPS”)(1).
- Adjusted EBITDA(1) of $36.6 million.
- Declared and paid an irregular dividend totaling $30.0 million in February 2025.
Highlights for the Fiscal Year Ended March 31, 2025
- Revenues of $353.3 million.
- TCE(1) per available day rate for our fleet of $39,778.
- Net income of $90.2 million, or $2.14 EPS, and adjusted net income(1) of $96.0 million, or $2.27 adjusted EPS(1).
- Adjusted EBITDA(1) of $206.0 million.
- Declared and paid four irregular dividends totaling $156.2 million.
- Issued 2,000,000 common shares at a price of $44.50 per share less underwriting discounts and commissions of $2.225 per share.
John Hadjipateras, Chairman, President, and Chief Executive Officer of the Company, commented, “In a volatile geopolitical and economic environment and with a heavy drydocking schedule, we achieved good results in our financial year 2025. Our capital allocation is focused on shareholder returns and preserving the strength of our balance sheet, enabling us to invest in our people and our business, as well as in fleet renewal and expansion when opportunities arise. I am grateful to and commend our seafarers and shore staff for their commitment to our mission to provide safe, reliable, clean, and trouble-free transportation. Though the trade and other important issues that may affect our business are not settled I am confident in the fundamentals of the LPG market and our teams’ readiness to respond constructively.”
Fourth Quarter Fiscal Year 2025 Results Summary
Our net income amounted to $8.1 million, or $0.19 per share, for the three months ended March 31, 2025, compared to net income of $79.2 million, or $1.96 per share, for the three months ended March 31, 2024.
Our adjusted net income amounted to $10.7 million, or $0.25 per share, for the three months ended March 31, 2025, compared to adjusted net income of $77.6 million, or $1.91 per share, for the three months ended March 31, 2024. We have adjusted our net income for the three months ended March 31, 2025 for an unrealized loss on derivative instruments of $2.6 million and we adjusted our net income for the three months ended March 31, 2024 for an unrealized gain on derivative instruments of $1.7 million. Please refer to the reconciliation of net income to adjusted net income, which appears later in this press release.
The $66.9 million decrease in adjusted net income for the three months ended March 31, 2025 compared to the three months ended March 31, 2024 is primarily attributable to (i) a decrease of $65.5 million in revenues; (ii) increases of $3.5 million in vessel operating expenses, and $1.3 million in voyage expenses; and (iii) reductions of $0.3 million in realized gain on derivatives and $0.5 million in other gain/(loss), net; partially offset by (i) decreases of $2.4 million in charter hire expenses, $1.7 million in interest and finance costs and $0.2 million in general and administrative expenses; and (ii) an increase of $0.3 million in interest income.
The TCE rate for our fleet was $35,324 for the three months ended March 31, 2025, a 44.3% decrease from the $63,375 TCE rate for the same period in the prior year period, as further described in “Revenues” below. Please see footnote 7 to the table in “Financial Information” below for other information related to how we calculate TCE.
Vessel operating expenses per day increased to $12,671 during the three months ended March 31, 2025 from $10,699 in the same period in the prior year. Please see “Vessel Operating Expenses” below for more information.
Revenues
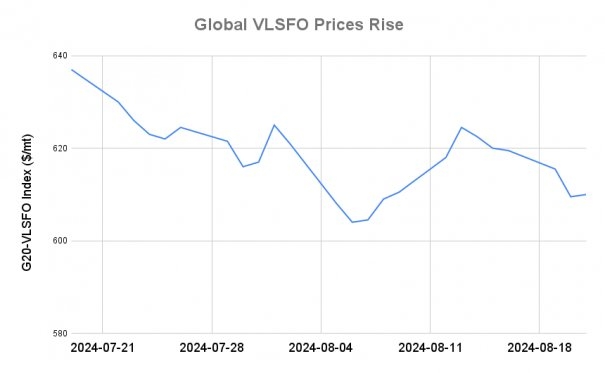
Revenues, which represent net pool revenues—related party, time charters and other revenues earned by our vessels, were $75.9 million for the three months ended March 31, 2025, a decrease of $65.5 million, or 46.3%, from $141.4 million for the three months ended March 31, 2024, primarily due to reduced average TCE rates, which declined by $28,051 per available day from $63,375 for the three months ended March 31, 2024 to $35,324 for the three months ended March 31, 2025. This reduction was primarily due to lower spot rates, partially offset by lower bunker prices. The Baltic Exchange Liquid Petroleum Gas Index, an index published daily by the Baltic Exchange for the spot market rate for the benchmark Ras Tanura-Chiba route (expressed as U.S. dollars per metric ton), averaged $68,429 during the three months ended March 31, 2024 compared to an average of $51,715 for the three months ended March 31, 2025. The average price of very low sulfur fuel oil (expressed as U.S. dollars per metric ton) from Singapore and Fujairah decreased from $653 during the three months ended March 31, 2024, to $556 during the three months ended March 31, 2025.
Vessel Operating Expenses
Vessel operating expenses were $23.9 million during the three months ended March 31, 2025, or $12,671 per vessel per calendar day, which is calculated by dividing vessel operating expenses by calendar days for the relevant time period for the technically managed vessels that were in our fleet and increased by $3.5 million, or 17.1%, from $20.4 million, or $10,699 per vessel per calendar day, for the three months ended March 31, 2024. The increase of $1,972 per vessel per calendar day was primarily the result of an increase of $1,017 per vessel per calendar day of non-capitalizable drydock-related operating expenses. Excluding non-capitalizable drydock-related operating expenses, daily operating expenses increased by $954 from $10,047 for the three months ended March 31, 2024 to $11,001 for the three months ended March 31, 2025 mainly as a result of increases in spares and stores, crew related costs, and vessel communications.
General and Administrative Expenses
General and administrative expenses were $8.3 million for the three months ended March 31, 2025, a decrease of $0.2 million, or 3.1%, from $8.5 million for the three months ended March 31, 2024. This decrease was mainly attributed to an decrease of $0.5 million in stock-based compensation expense, partially offset by an increase of $0.3 million in other general and administrative expenses.
Interest and Finance Costs
Interest and finance costs amounted to $8.0 million for the three months ended March 31, 2025, a decrease of $1.7 million, or 17.7%, from $9.7 million for the three months ended March 31, 2024. The decrease of $1.7 million during the three months ended March 31, 2025 was mainly due to a decrease of $1.3 million in interest incurred on our long-term debt and an increase of $0.4 million in capitalized interest. The decrease in interest on our long-term debt was driven by a decrease in average indebtedness, excluding deferred financing fees, decreased from $619.9 million for the three months ended March 31, 2024 to $566.4 million for the three months ended March 31, 2025. As of March 31, 2025, the outstanding balance of our long-term debt was $557.4 million.
Unrealized Gain/(Loss) on Derivatives
Unrealized loss on derivatives amounted to approximately $2.6 million for the three months ended March 31, 2025, compared to gain of $1.7 million for the three months ended March 31, 2024. The $4.3 million unfavorable change is primarily attributable to changes in forward SOFR yield curves and changes in notional amounts.
Realized Gain on Derivatives
Realized gain on derivatives was $1.1 million for the three months ended March 31, 2025 compared to $1.8 million for the three months ended March 31, 2024. The unfavorable $0.7 million difference is due to a decrease in realized gains on our interest rate swaps.
Fiscal Year 2025 Results Summary
Our net income amounted to $90.2 million, or $2.14 per share, for the year ended March 31, 2025, compared to net income of $307.4 million, or $7.60 per share, for the year ended March 31, 2024.
Our adjusted net income amounted to $96.0 million, or $2.27 per share, for the year ended March 31, 2025, compared to adjusted net income of $307.4 million, or $7.60 per share, for the year ended March 31, 2024. We have adjusted our net income for the year ended March 31, 2025 for an unrealized loss on derivatives of $5.8 million and we have adjusted our net income for the year ended March 31, 2024 for an unrealized gain on derivative instruments of less than $0.1 million. Please refer to the reconciliation of net income to adjusted net income, which appears later in this press release.
The unfavorable change of $211.4 million in adjusted net income for the year ended March 31, 2025 compared to the year ended March 31, 2024 is primarily attributable to (i) decreases in revenues of $207.4 million; (ii) increases of $4.9 million in vessel operating expenses, $3.6 million in general and administrative expenses, $1.6 million in voyage expenses, $0.9 in depreciation and amortization; and (iii) reductions of $2.2 million in realized gain on derivatives and $3.5 million in other gain/(loss), net; partially offset by (i) decreases of $4.7 in interest and finance costs and $2.3 in charter hire expenses; and (ii) an increase of $5.7 million in interest income.
The TCE rate for our fleet was $39,778 for the year ended March 31, 2025, a 36.0% decrease from the $62,129 TCE rate from the prior year, as further described in “Revenues” below. Please see footnote 7 to the table in “Financial Information” below for other information related to how we calculate TCE.
Vessel operating expenses per day increased to $11,143 in the year ended March 31, 2025 from $10,469 in the prior year. Please see “Vessel Operating Expenses” below for more information.
Revenues
Revenues, which represent net pool revenues—related party, time charters and other revenues, net, were $353.3 million for the year ended March 31, 2025, a decrease of $207.4 million, or 37.0%, from $560.7 million for the year ended March 31, 2024, primarily due to reduced average TCE rates and available days. TCE rates declined by $22,351 per available day from $62,129 for the year ended March 31, 2024 to $39,778 for the year ended March 31, 2025. This reduction was primarily due to lower spot rates, partially offset by moderately lower bunker prices. The Baltic Exchange Liquid Petroleum Gas Index, an index published daily by the Baltic Exchange for the spot market rate for the benchmark Ras Tanura-Chiba route (expressed as U.S. dollars per metric ton), averaged $104.948 during the year ended March 31, 2024 compared to an average of $57.951 for the year ended March 31, 2025. The average price of very low sulfur fuel oil (expressed as U.S. dollars per metric ton) from Singapore and Fujairah decreased from $621 during the year ended March 31, 2024, to $591 during the year ended March 31, 2025. Additionally, available days for our fleet declined from 8,982 for the year ended March 31, 2024 to 8,776 for the year ended March 31, 2025, mainly driven by an increase in the number of vessels drydocked.
Vessel Operating Expenses
Vessel operating expenses were $85.4 million during the year ended March 31, 2025, or $11,143 per vessel per calendar day, which is calculated by dividing vessel operating expenses by calendar days for the relevant time period for the technically managed vessels that were in our fleet and increased by $4.9 million, or 6.1%, from $80.5 million, or $10,469 per vessel per calendar day, for the year ended March 31, 2024. The increase of $674 per vessel per calendar day, from $10,469 for the year ended March 31, 2024 to $11,143 per vessel per calendar day for the year ended March 31, 2025 was primarily the result of an increase of $404 per vessel per calendar day of non-capitalizable drydock-related operating expenses. Excluding non-capitalizable drydock-related operating expenses, daily operating expenses increased by $271 from $10,112 for the year ended March 31, 2024 to $10,383 for the year ended March 31, 2025 mainly as a result of increases in vessel communications, crew related costs, and spares and stores.
General and Administrative Expenses
General and administrative expenses were $42.6 million for the year ended March 31, 2025, an increase of $3.6 million, or 9.3%, from $39.0 million for the year ended March 31, 2024, primarily driven by increases of $2.1 million in stock-based compensation expense, $1.0 million in cash bonuses, and $0.9 million in employee-related costs and benefits, partially offset by a reduction of $0.4 million in other general and administrative expenses.
Interest and Finance Costs
Interest and finance costs amounted to $35.8 million for the year ended March 31, 2025, a decrease of $4.7 million from $40.5 million for the year ended March 31, 2024. The decrease of $4.7 million during the year ended March 31, 2025 was driven by a decrease of $4.4 million in interest incurred on our long-term debt and an increase of $0.4 million in capitalized interest, partially offset by a decrease of $0.1 million in loan expenses and bank charges. The decrease in interest on our long-term debt was driven by a reduction of average indebtedness, excluding deferred financing fees, from $639.9 million for the year ended March 31, 2024 to $586.6 million for the year ended March 31, 2025. As of March 31, 2025, the outstanding balance of our long-term debt, excluding deferred financing fees, was $557.4 million.
Interest Income
Interest income amounted to $15.2 million for the year ended March 31, 2025, compared to $9.5 million for the year ended March 31, 2024. The increase of $5.7 million is mainly attributable to higher average cash balances for the year ended March 31, 2025 when compared to the year ended March 31, 2024.
Unrealized Gain/(Loss) on Derivatives
Unrealized loss on derivatives amounted to $5.8 million for the year ended March 31, 2025 compared to a gain of less than $0.1 million for the year ended March 31, 2024. The $5.8 million difference is primarily attributable to changes in forward SOFR yield curves and changes in notional amounts.
Realized Gain on Derivatives
Realized gain on derivatives was $5.3 million for the year ended March 31, 2025, compared to $7.5 million for the year ended March 31, 2024. The unfavorable $2.2 million difference is largely due to (1) a $1.7 million decrease in realized gains on our interest rate swaps and (2) a realized loss on our forward freight agreements totaling $0.5 million.
Fleet
The following table sets forth certain information regarding our fleet as of May 16, 2025. We classify vessel employment as either Time Charter, Pool or Pool-TCO.
Market Outlook Update
High volatility over the first calendar quarter of 2025 (“Q1 2025”) was seen overall in the oil and gas markets with the beginning of trade tariff announcements by U.S. President Donald Trump. In February, the U.S. announced trade tariffs on the import of some exports from Mexico, Canada and China into the U.S. Reciprocal tariffs announced in Q1 2025 did not initially include LPG imports from the U.S. to China, the most important trade in the global LPG market, but these were implemented in the second calendar quarter of 2025 (“Q2 2025”). Geopolitical tensions in the Middle East continued to weigh on markets overall and are expected to continue, as additional sanctions on Iranian cargoes are expected.
Several extended periods of low temperatures in the U.S. were one of the biggest influences on the LPG market in Q1 2025, contributing to higher Mt Belvieu LPG prices and limited exports from the U.S., particularly in February 2025. U.S. LPG exports fell from over 5.6 million metric tons (“MMT”) in January 2025 to 4.9 MMT in February 2025 helping contribute to an overall 1 MMT drop in LPG seaborne supply in February 2025 from the previous month. Higher domestic retail demand in the U.S. and continued exports of over 5 MMT per month led to a significant drawdown of inventory levels to below the 5-year average by the end of February 2025. As a result, average propane prices vs. West Texas Intermediate (“WTI”) in the U.S. Gulf increased from 50% in January to 54% in February, remaining at this level for the remainder of the quarter. Lower Saudi Arabian exports were seen in February 2025 with levels dropping by nearly 0.3MMT from January to reach 0.39 MMT in February 2025. CP propane and butane prices saw an increase in February 2025 before subsiding in March 2025 again.
Persistent strength in feedstock prices continued to weigh on the petrochemical markets with propane dehydrogenation (“PDH”) margins remaining negative in the Far East for the production of propylene. Propane prices in the Far East were on average 65% of Brent oil in Q1 2025, compared to 58% of Brent in the first calendar quarter of 2024. Despite some capacity being offline for maintenance throughout Q1 2025, overall overcapacity remained for propylene and ethylene in spite of a delay in start-up for several facilities. A new PDH plant began in China in February 2025 bringing the total number of PDH plants operating in China to 46 plants. With this addition, Chinese dehydrogenation capacity currently stands at around 26 MMT of LPG per year with total demand calculated in 2024 to be 17 MMT. Naphtha margins for the production of ethylene via steam crackers remained negative in the Far East, however, saw improvements in NW Europe recovering from the lower levels seen in the fourth calendar quarter of 2024. The propane-naphtha spread widened in both the East and in NW Europe, on average in Q1 2025 compared to the previous quarter.
However, towards the end of the quarter, economics deteriorated for utilizing propane as a feedstock for the production of ethylene via steam cracking with margins turning negative at the end of March 2025. Both propane and butane however remained advantageous vs naphtha in both the West and East. Weak petrochemical economics overall, kept demand in the East tepid with total LPG imports into China in Q1 2025 remaining at 8.5 MMT, far lower than the 10.1 MMT level achieved in the second calendar quarter of 2024.
Difficult arbitrage economics from the US to importers in the Far East was seen in Q1 2025 squeezing terminal fees and freight rates at times. Average freight rates retreated in Q1 2025 with a significant drop seen in February 2025 as VLGC supply/demand fundamentals were weak. Rates were seen to improve in March 2025 with the Baltic averaging over $52 per metric ton in March 2025 compared to $46 per metric ton in February 2025. The VLGC market remains highly sensitive to the supply chain economics and reactions of geopolitical decisions, particularly the US-China relationship and impact of trade tariffs.
In Q1 2025, three new VLGCs were added to the market, representing a modest addition to the global fleet. An additional 108 VLGCs/VLACs, equivalent to roughly 9.7 million cbm of carrying capacity, are expected to be added to the global fleet by calendar year 2029. The average age of the global fleet is now approximately 10.5 years old. Currently, the VLGC orderbook stands at approximately 26.8% of the global fleet.
The above market outlook update is based on information, data and estimates derived from industry sources available as of the date of this release, and there can be no assurances that such trends will continue or that anticipated developments in freight rates, export volumes, the VLGC orderbook or other market indicators will materialize. This information, data and estimates involve a number of assumptions and limitations, are subject to risks and uncertainties, and are subject to change based on various factors. You are cautioned not to give undue weight to such information, data and estimates. We have not independently verified any third-party information, verified that more recent information is not available and undertake no obligation to update this information unless legally obligated.
Seasonality
Liquefied gases are primarily used for industrial and domestic heating, as chemical and refinery feedstock, as transportation fuel and in agriculture. The LPG shipping market historically has been stronger in the spring and summer months in anticipation of increased consumption of propane and butane for heating during the winter months. In addition, unpredictable weather patterns in these months tend to disrupt vessel scheduling and the supply of certain commodities. Demand for our vessels therefore may be stronger in our quarters ending June 30 and September 30 and relatively weaker during our quarters ending December 31 and March 31, although 12-month time charter rates tend to smooth out these short-term fluctuations and recent LPG shipping market activity has not yielded the typical seasonal results. The increase in petrochemical industry buying has contributed to less marked seasonality than in the past, but there can no guarantee that this trend will continue.
To the extent any of our time charters expire during the typically weaker fiscal quarters ending December 31 and March 31, it may not be possible to re-charter our vessels at similar rates. As a result, we may have to accept lower rates or experience off-hire time for our vessels, which may adversely impact our business, financial condition and operating results.
Financial Information
The following table presents our selected financial data (unaudited) and other information for the periods presented:
In addition to the results of operations presented in accordance with U.S. GAAP, we provide adjusted net income and adjusted EPS. We believe that adjusted net income and adjusted EPS are useful to investors in understanding our underlying performance and business trends. Adjusted net income and adjusted EPS are not a measurement of financial performance or liquidity under U.S. GAAP; therefore, these non-U.S. GAAP financial measures should not be considered as an alternative or substitute for U.S. GAAP. The following table reconciles (unaudited) net income and EPS to adjusted net income and adjusted EPS, respectively, for the periods presented:
Source: Dorian LPG Ltd