EU LNG Imports on the Rise

The EU retained its lead as the biggest LNG importer, significantly increasing its imports during the first half of the year. In its latest weekly report, shipbroker Banchero Costa said that “global seaborne LNG trade was increasing sharply until 2022, helped also by the events in Ukraine which forced Europe to diversify away from Russian pipeline gas. In Jan-Dec 2023, however, global shipments of LNG increased by just +1.4% y-o-y to 408.7 mln t, based on Refinitiv/LSEG vessel tracking data. In Jan-Dec 2024 there was no growth at all, with shipment volumes flat +0.0% y-o-y at 408.8 mln t. In 1H 2025, on the other hand, we saw a rebound, with global exports increasing by +3.0% y-o-y to 210.5 mln t, from 204.3 mln t in 1H 2024. The largest exporter of LNG is now the USA, which accounted for 24.8% of shipments in 1H 2025, followed by Qatar with 19.6%, Australia with 18.8%, South-East Asia with 10.5%. In Jan-Jun 2025, the USA exported 52.2 mln tonnes of LNG, which represented a +20.2% y-o-y increase from 43.4 mln t shipped in 1H 2024. Qatar exported 41.2 mln tonnes in Jan-Jun 2025, up +6.5% y-o-y. Australia shipped 39.5 mln tonnes in Jan-Jun 2025, down -3.5% y-o-y. From South East Asia shipments declined -4.7% y-o-y to 22.0 mln t. Russia shipped 15.1 mln tonnes of LNG in 1H 2025, down -4.9% y-o-y from 15.9 mln t in 1H 2024”.
Source: Banchero Costa
According to Banchero Costa, “the European Union remains the world’s largest importer of LNG, accounting for 25.2% of global LNG imports. In 1H 2025, the EU imported 53.3 mln t, up +18.5% y-o-y from 45.0 mln t in 1H 2024, and also above the record 51.6 mln t in 1H 2023. The United Kingdom imported 5.6 mln tonnes of LNG in 1H 2025, up +32.8% y-o-y from the 4.2 mln t in 1H 2024, but well below the 10.8 mln imported in 1H 2023. Mainland China imported 30.7 mln tonnes of LNG in 1H 2025, down -21.3% y-o-y from 39.0 mln t in JanJun 2024. Japan imported 33.5 mln t in 1H 2025, up +1.2% y-o-y. South Korea imported 24.6 mln t in 1H 2025, up +2.3% y-o-y. India imported 12.0 mln t in 1H 2025, down -8.2% y-o-y”.
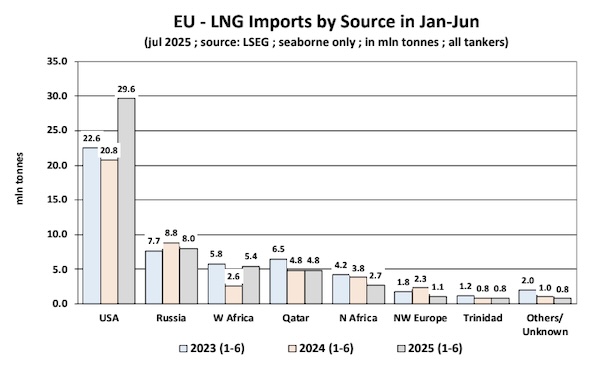
“Let’s now focus a bit more on Europe. In Jan-Dec 2022, LNG imports into the European Union jumped by +67.6% y-o-y to 100.1 mln tonnes, as the region tried to diversify away from Russian pipeline gas supply. In Jan-Dec 2023, the EU’s LNG imports nudged further up by +1.7% y-o-y to 101.8 mln t. In Jan-Dec 2024, imports into the EU corrected downwards by -18.4% y-oy to 83.1 mln t. This was still well above the 59.7 mln t imported in 2021 or the 62.8 mln t imported in 2020. As already mentioned above, in the first half of 2025, imports into the EU jumped up by +18.5% y-o-y to 53.3 mln t, from 45.0 mln t in 1H 2024, and also above the record 51.6 mln t in 1H 2023. Top LNG discharge ports in the European Union in 2024 were: Rotterdam (10.3 mln t in Jan-Dec 2024), Dunkirk (7.7 mln t), Zeebrugge (7.4 mln t), Porto Levante (6.2 mln t), Fos (5.9 mln t), Swinoujscie (4.8 mln t), Montoir (3.7 mln t), Sines (3.5 mln t), Bilbao (3.4 mln t), Eemshaven (2.8 mln t), Wilhelmshaven (2.7 mln t), Piombino (2.7 mln t), Huelva (2.3 mln t). In terms of sources for European LNG imports, the United States now account for a massive 55.6% share.
Source: Banchero Costa
In Jan-Jun 2025, the European Union imported 29.6 mln tonnes of LNG from the United States, up +42.5% yo-y from the 20.8 mln tonnes in the first half od 2024. Shipments from Russia to the European Union declined by -8.8% yo-y in 1H 2025 to 8.0 mln t from 8.8 mln t in 1H 2024. Nevertheless, volumes from Russia to Europe remain relatively steady, as they are above the 7.7 mln t in 1H 2023 and the 6.4 mln t in 1H 2021 Russia now accounts for 15.0% of the EU’s total LNG imports. Imports from West Africa bounced back by +108.4% in 1H 2025 to 5.4 mln t, but are still below the 5.8 mln t in 1H 2023”, the shipbroker concluded.
Nikos Roussanoglou, Hellenic Shipping News Worldwide