Dry Bulk Shipping: China The Dominant Market for US Soybeans

Despite the rising trade tensions, China is still the main destination for US soybeans. In its latest weekly report, shipbroker Banchero Costa said that “total seaborne exports of soybeans in calendar (Jan-Dec) 2024 declined by -5.0% year-on-year to 142.3 mln tonnes, according to vessel tracking data from AXS Marine. This was a correction from the +10.2% y-o-y growth recorded in 2023, and global trade volumes were still higher than the 135.9 mln tonnes in 2022 and the 141.7 mln tonnes in 2021. Soybeans are one of the most important dry bulk commodities, and account for almost 5 percent of all seaborne dry bulk trade”.
Source: Banchero Costa
According to Banchero Costa, “the largest exporter of soybeans by far is Brazil, which accounted for 68.2% of global soybean exports by volume in calendar 2024. In Jan-Dec 2024, shipments from Brazil declined by -4.8% y-o-y to 97.0 mln tonnes, down from the record high 101.9 mln tonnes exported in calendar 2023. In second place are the United States, which accounted for 22.8% of global soybean exports in Jan-Dec 2024. In Jan-Dec 2024, soybean exports from the USA declined by -16.5% yo-y to 32.4 mln tonnes. This was the lowest volume in at least a decade. Far in third place is Argentina, with a 3.7% share in 2024. In Jan-Dec 2024, Argentina exported 4.9 mln tonnes of soybeans, up +141.0% y-o-y from the 2.1 mln t in 2023, but slightly below the 5.5 mln tonnes in 2022. In terms of imports, the top destination for soybeans in 2024 was Mainland China, accounting for 67.7% of global seaborne imports. Imports to China declined by -2.0% y-o-y in Jan-Dec 2024 to 100.8 mln tonnes. Imports to the EU increased by +4.5% y-o-y in 2024 to 13.7 mln t. The EU accounted for 9.2% of global seaborne soybean imports”.

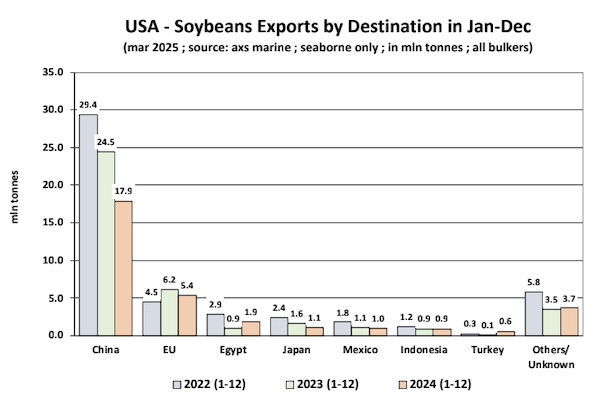
The shipbroker added that “let’s now focus on the United States, which as we mentioned above is the second largest exporter of soybeans with a 22.8% share. Top soybean loading ports in the United States in 2024 were: Reserve in Louisiana (6.7 mln t in Jan-Dec 2024), Convent in Louisiana (5.9 mln t), New Orleans (3.2 mln t), Destrehan (2.5 mln t), Kalama (2.4 mln t), Baton Rouge (2.0 mln t), Seattle (1.7 mln t). 64.2% of soybeans exports from the USA in 2024 were loaded on Panamaxes, 31.1% on Supramaxes, 3.5% on Handies”.
Source: Banchero Costa
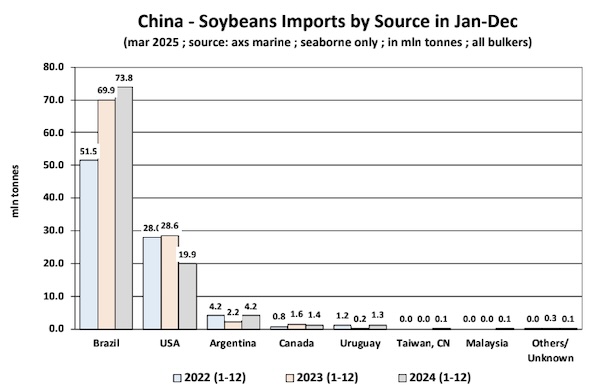
“Uncomfortably, considering the ongoing geopolitical situation, the major destination by far of American soybeans is Mainland China. Mainland China accounted for 55.1% of the USA’s total seaborne soybean exports in 2024. Volumes on this route has been more or less steadily declining in recent years. However, this reflects an overall decline in exports from the Usa rather than a rerouting to alternative buyers. Soybean shipments from the USA to China declined by -27.1% y-o-y in Jan-Dec 2024 to 17.9 mln tonnes, following a -16.7% y-o-y decline in Jan-Dec 2023. In second place was the European Union, which however accounted for just 16.7% of soybean exports from the USA. In Jan-Dec 2024, volumes from the USA to the EU declined by -11.9% yo-y to 5.4 mln tonnes. In third place was Egypt, but accounting for just 5.8% of US exports, i.e. 1.9 mln tonnes per year. It seems clear that US exporters have no real alternative to the Chinese market, and the recently announced tariffs on US soybeans by China are going to hurt. Looking at China, import volumes remain robust. In Jan-Dec 2024, soybean imports into China corrected by -2.0% y-o-y to 100.8 mln t. However, this follows a +20.2% y-o-y increase in 2023. Brazil accounted for 73.2% of China’s soybean imports in Jan-Dec 2024, and volumes from Brazil to China increased by +5.5% y-o-y in 2024 and by +35.8% y-o-y in 2023”.
Nikos Roussanoglou, Hellenic Shipping News Worldwide